A couple of experiences recently have reminded me that I ought to rely more on profilers when debugging performance problems. Usually I'll start with logging/printing or inline REPLs to figure out where the time is taking, but in heavily iterative functions, a profiler identifies the cause much more quickly.
1. Augeas path expression performance
Two users mentioned that Augeas's path expression performance was terrible in some circumstances. One was working on an Augeas provider for Puppet and it was slow matching entries when there were hundreds or thousands of services defined in a Nagios config, while netcf developers reported the utility was very slow with hundreds of VLAN interfaces.
Specifically it was found that filtering of nodes from the in-memory tree was
slow when they had the same label, even when accessed directly by index, e.g.
/files/foo[0] or /files/foo[512]. Running Valgrind's callgrind
utility against a simple test run of the binary showed a huge proporation of
time in the ns_add and memmove functions.
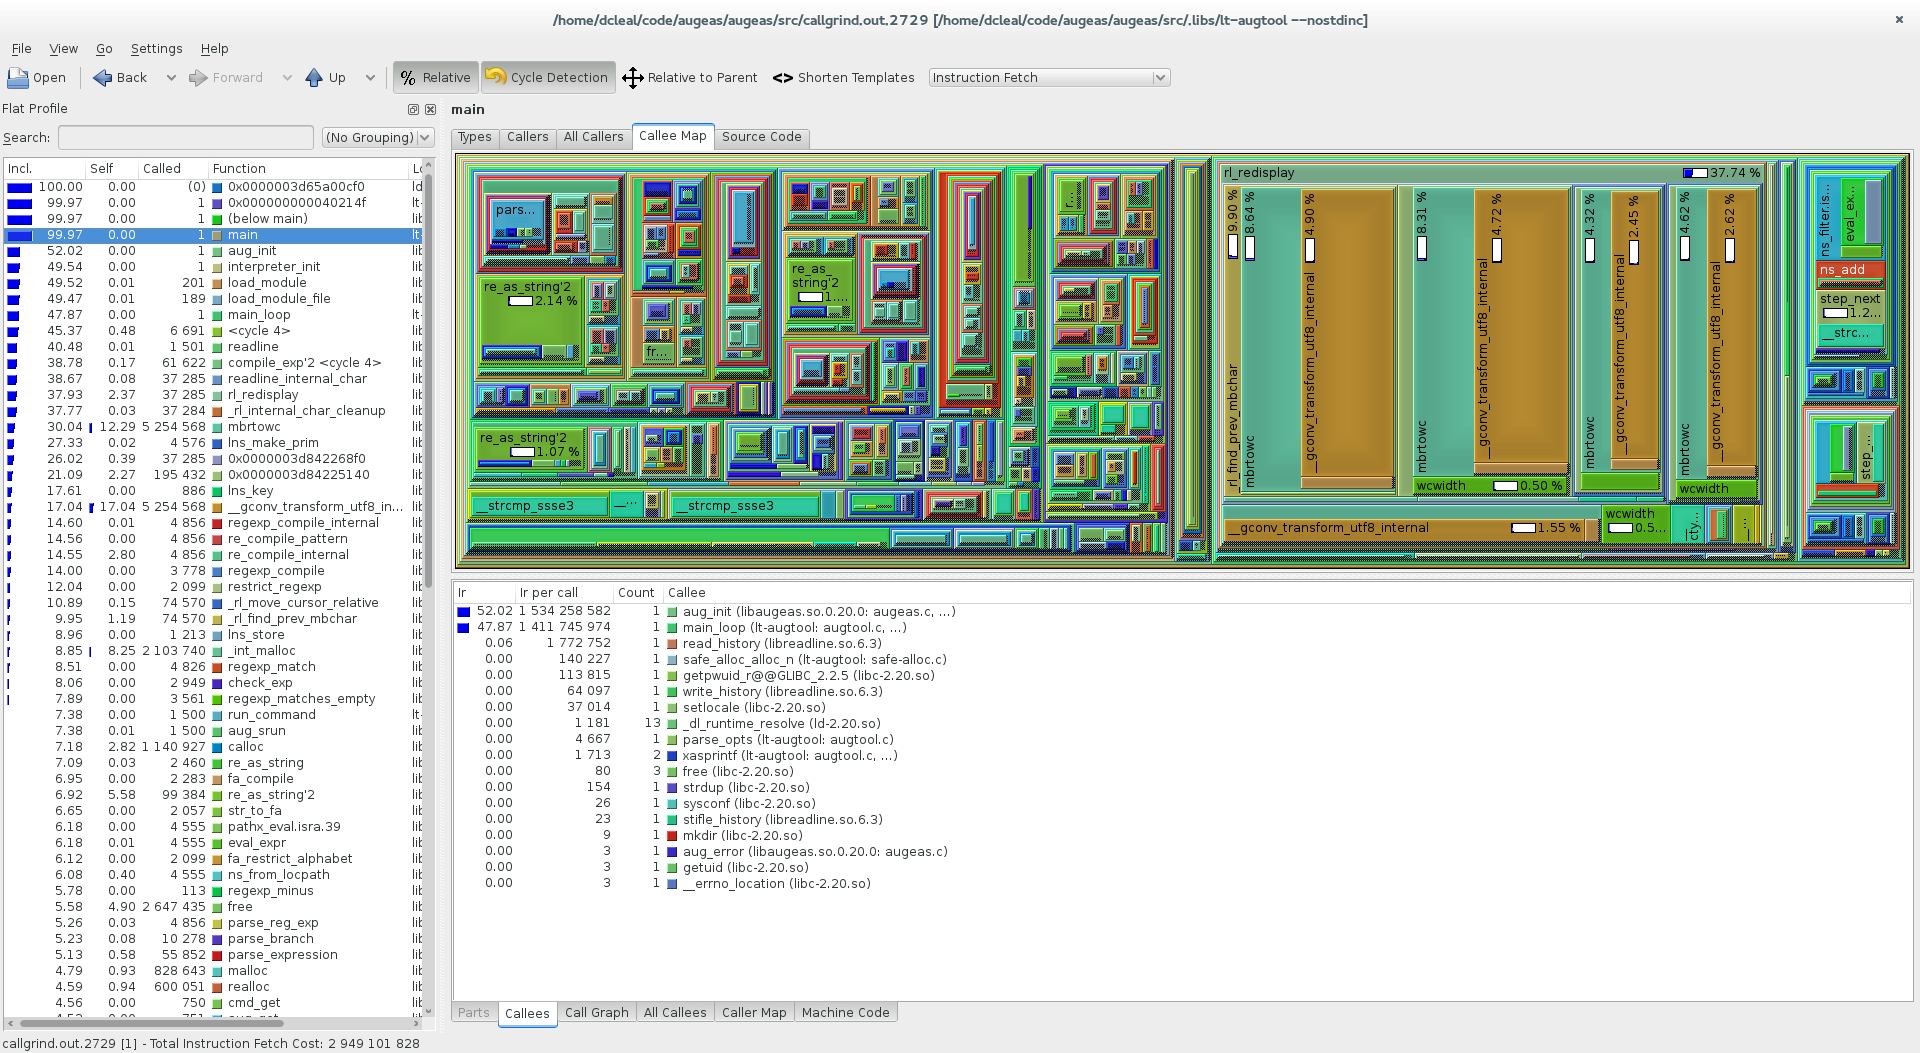
Using KCachegrind to analyse the output file from callgrind:

Visually it's very easy to spot where the time's taken up from the callee map. The two candidates are the red and yellow squares shown on the left, which are being called through two different paths (hence showing up twice). The third large group of functions are from the readline library initialisation (since I was testing the CLI, not the API), and the fourth block is Augeas' own initialisation. These have a much more regular spread of time spent in functions.
The bulk of the time in the two functions on the left was eliminated by David by:
- Replacing an expensive check in ns_add that was attempting to build a set of unique nodes. Instead of rescanning the existing set each time to see if the new node was already present, a flag inside the node indicates if it's already been added.
- Replacing many memmove calls with batched calls. Instead of removing candidate nodes from the start of a list by memmoving the rest of the list towards the start as each one is identified, the number to remove is batched and removed in one operation.
After fixing it, the group of expensive ns_* functions have moved completely in the callee map. They're now over on the right hand side of KCachegrind, leaving aug_init being the most expensive part, followed by readline, followed by the actual filtering.
2. JGrep filtering performance
Puppet module tests for theforeman/puppet had recently started timing out during startup of the test. The dependencies would install, the RSpec test framework would start up and there would be a long pause before it started listing tests that were running. This caused a timeout on Travis CI and the cancellation of the builds after 10 minutes of inactivity.
Julien dug into it and narrowed it down to a method call to rspec-puppet-facts, which loads hashes of system data (facts) for each supported operating systems and generates sets of tests for each OS. This in turn calls facterdb, a simple library that loads JSON files into memory and provides a filtering API using jgrep. On my system, this was taking about seven or eight seconds per call and per test, so a total of about two minutes on this one method call.
I was rather prejudiced when I started looking at this, as I knew from chasing a Heisenbug into facterdb a few weeks earlier that it loaded all of its JSON files into one large string before passing it into JGrep to be deserialised and filtered. I figured that it was either taking a long time to parse or deserialise the huge blob of JSON or that it was too large to filter quickly. Putting some basic logging into the method showed that I was completely wrong about the JSON, it was extremely quick to parse and was a non-issue.
Next up, with some basic logging and inserting pry (a REPL) into jgrep, I could see that parsing the filter string was taking about 2/3 of the time and then applying it another 1/3. This surprised me, because although the filter string was reasonably complex (it lists all of the supported OSes and versions), it was only a few lines long. Putting ruby-prof around the JGrep method call quickly showed where the issues lay.
ruby-prof has a variety of output formats, including writing callgrind-compatible files which can be imported straight into KCachegrind. These quickly showed an alarming amount of time splitting strings and matching regular expressions:
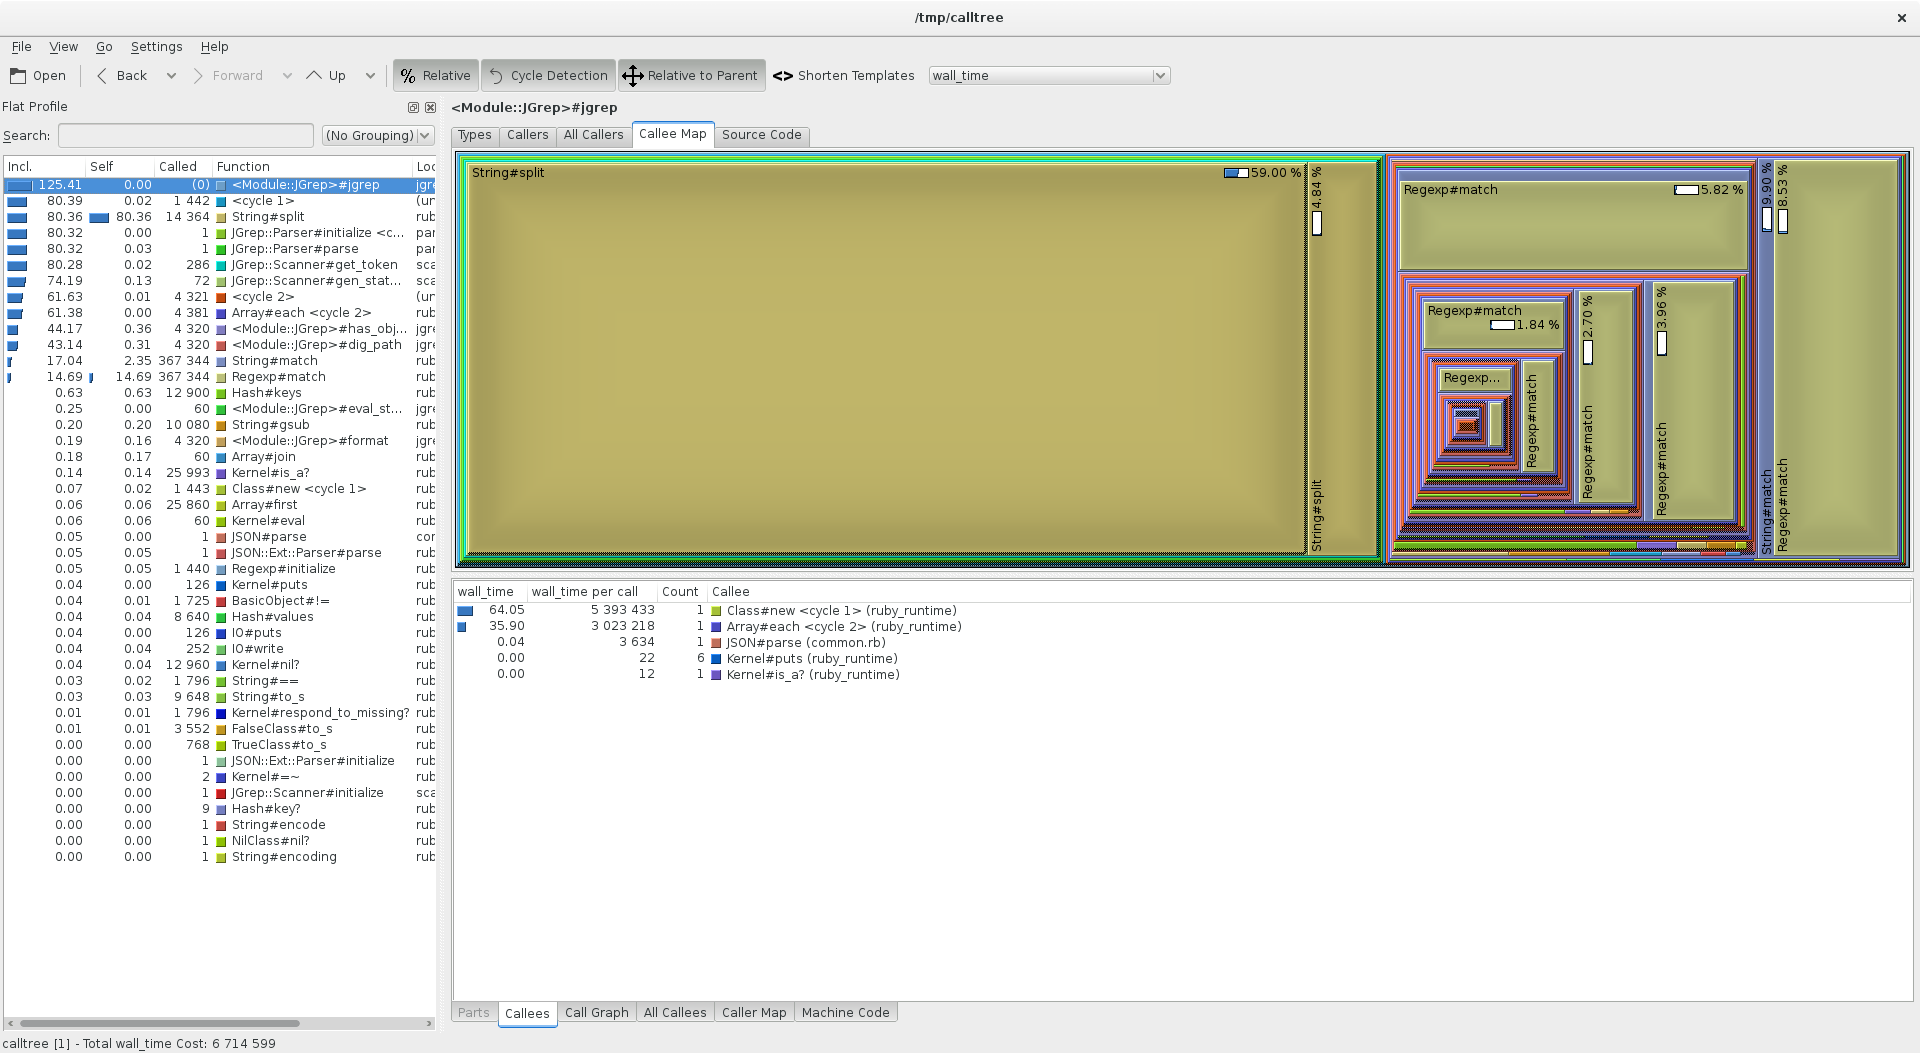
The string splitting was only in order to access individual characters in an
array during parsing of the grep filter, so this could easily be replaced by
String#[] for an instant performance boost.
The regex matching was mostly to
check whether certain characters were in strings, or if the string started with
certain substrings, both of which could be done much more cheaply with
String#include? and String#start_with?.
After these two small changes, the map
looks a lot healthier with a more even distribution of runtime between methods:
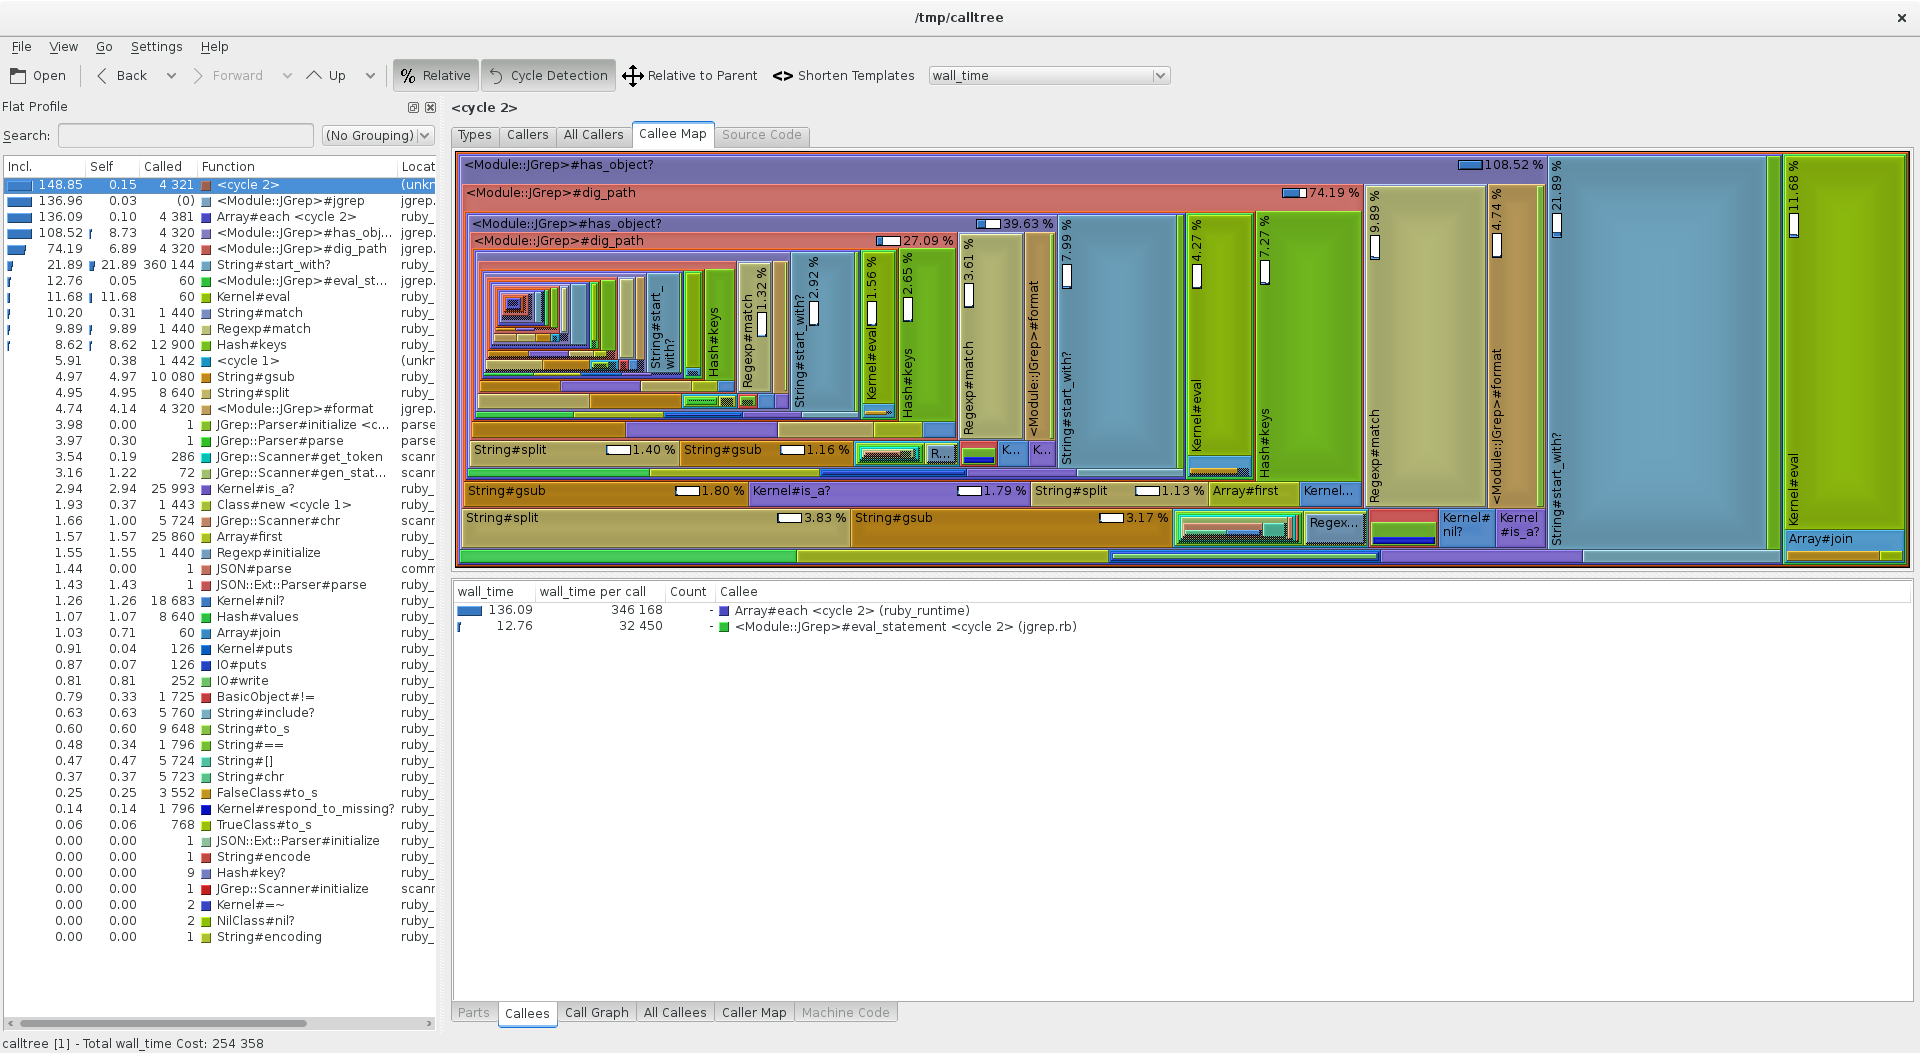
Actual runtime has dropped from 7-8 seconds to a fraction of a second, and tests no longer timeout during startup.
Both callgrind and ruby-prof are extremely easy to use - it's just a matter of
running a binary under Valgrind for the former, and wrapping a code block in a
RubyProf.profile call for the latter - and the results from fixing
some low-hanging performance problems is very satisfying!